Empirical Methods in Finance

Part 9

Henrique C. Martins

Synthetic Control

Synthetic Control

It is a method to estimate the effect of events or policy interventions, often at an aggregate level (cities, states, etc.)

The event occurs often in only one unit.

It compares the evolution of the outcome for the treated unit to the evolution of the control group.

  • The control group contains many units.

The limitation is often the selection of the control group. It is very ambiguous.

Synthetic Control

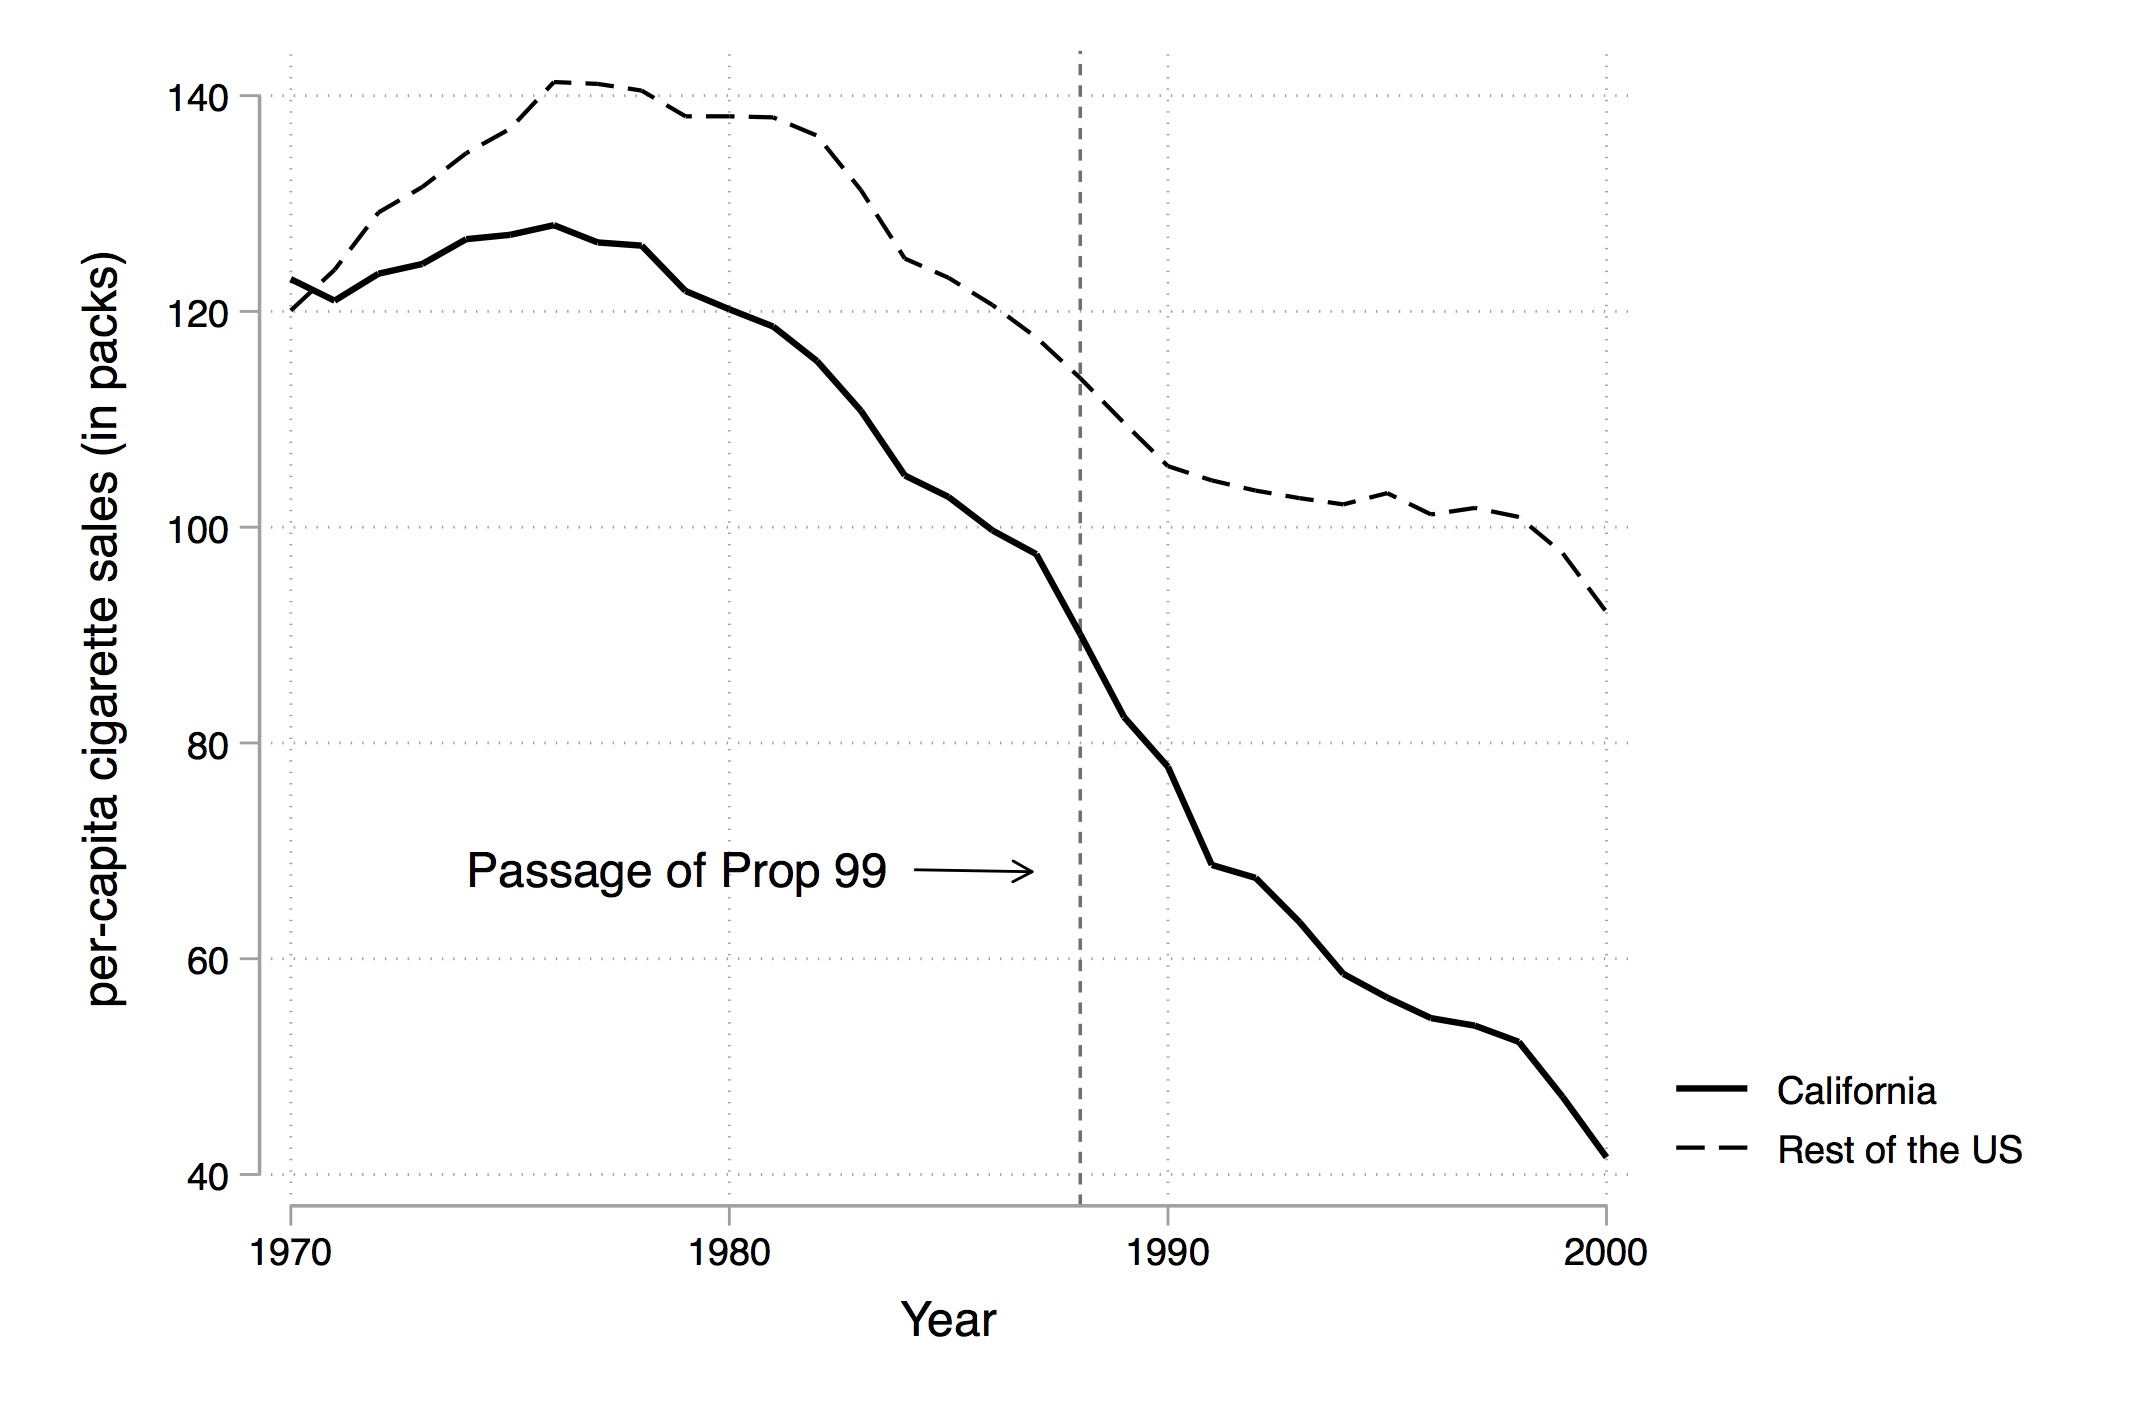
Abadie, Diamond, and Hainmueller (2010) apply synth by using a cigarette tax in California called Proposition 99.

In 1988, California passed comprehensive tobacco control legislation called Proposition 99.

Proposition 99 increased cigarette taxes by $0.25 a pack, spurred clean-air ordinances throughout the state, funded anti-smoking media campaigns, earmarked tax revenues to health and anti-smoking budgets, and produced more than $100 million a year in anti-tobacco projects.

Other states had similar control programs, and they were dropped from their analysis. Mastering Metrics

Synthetic Control

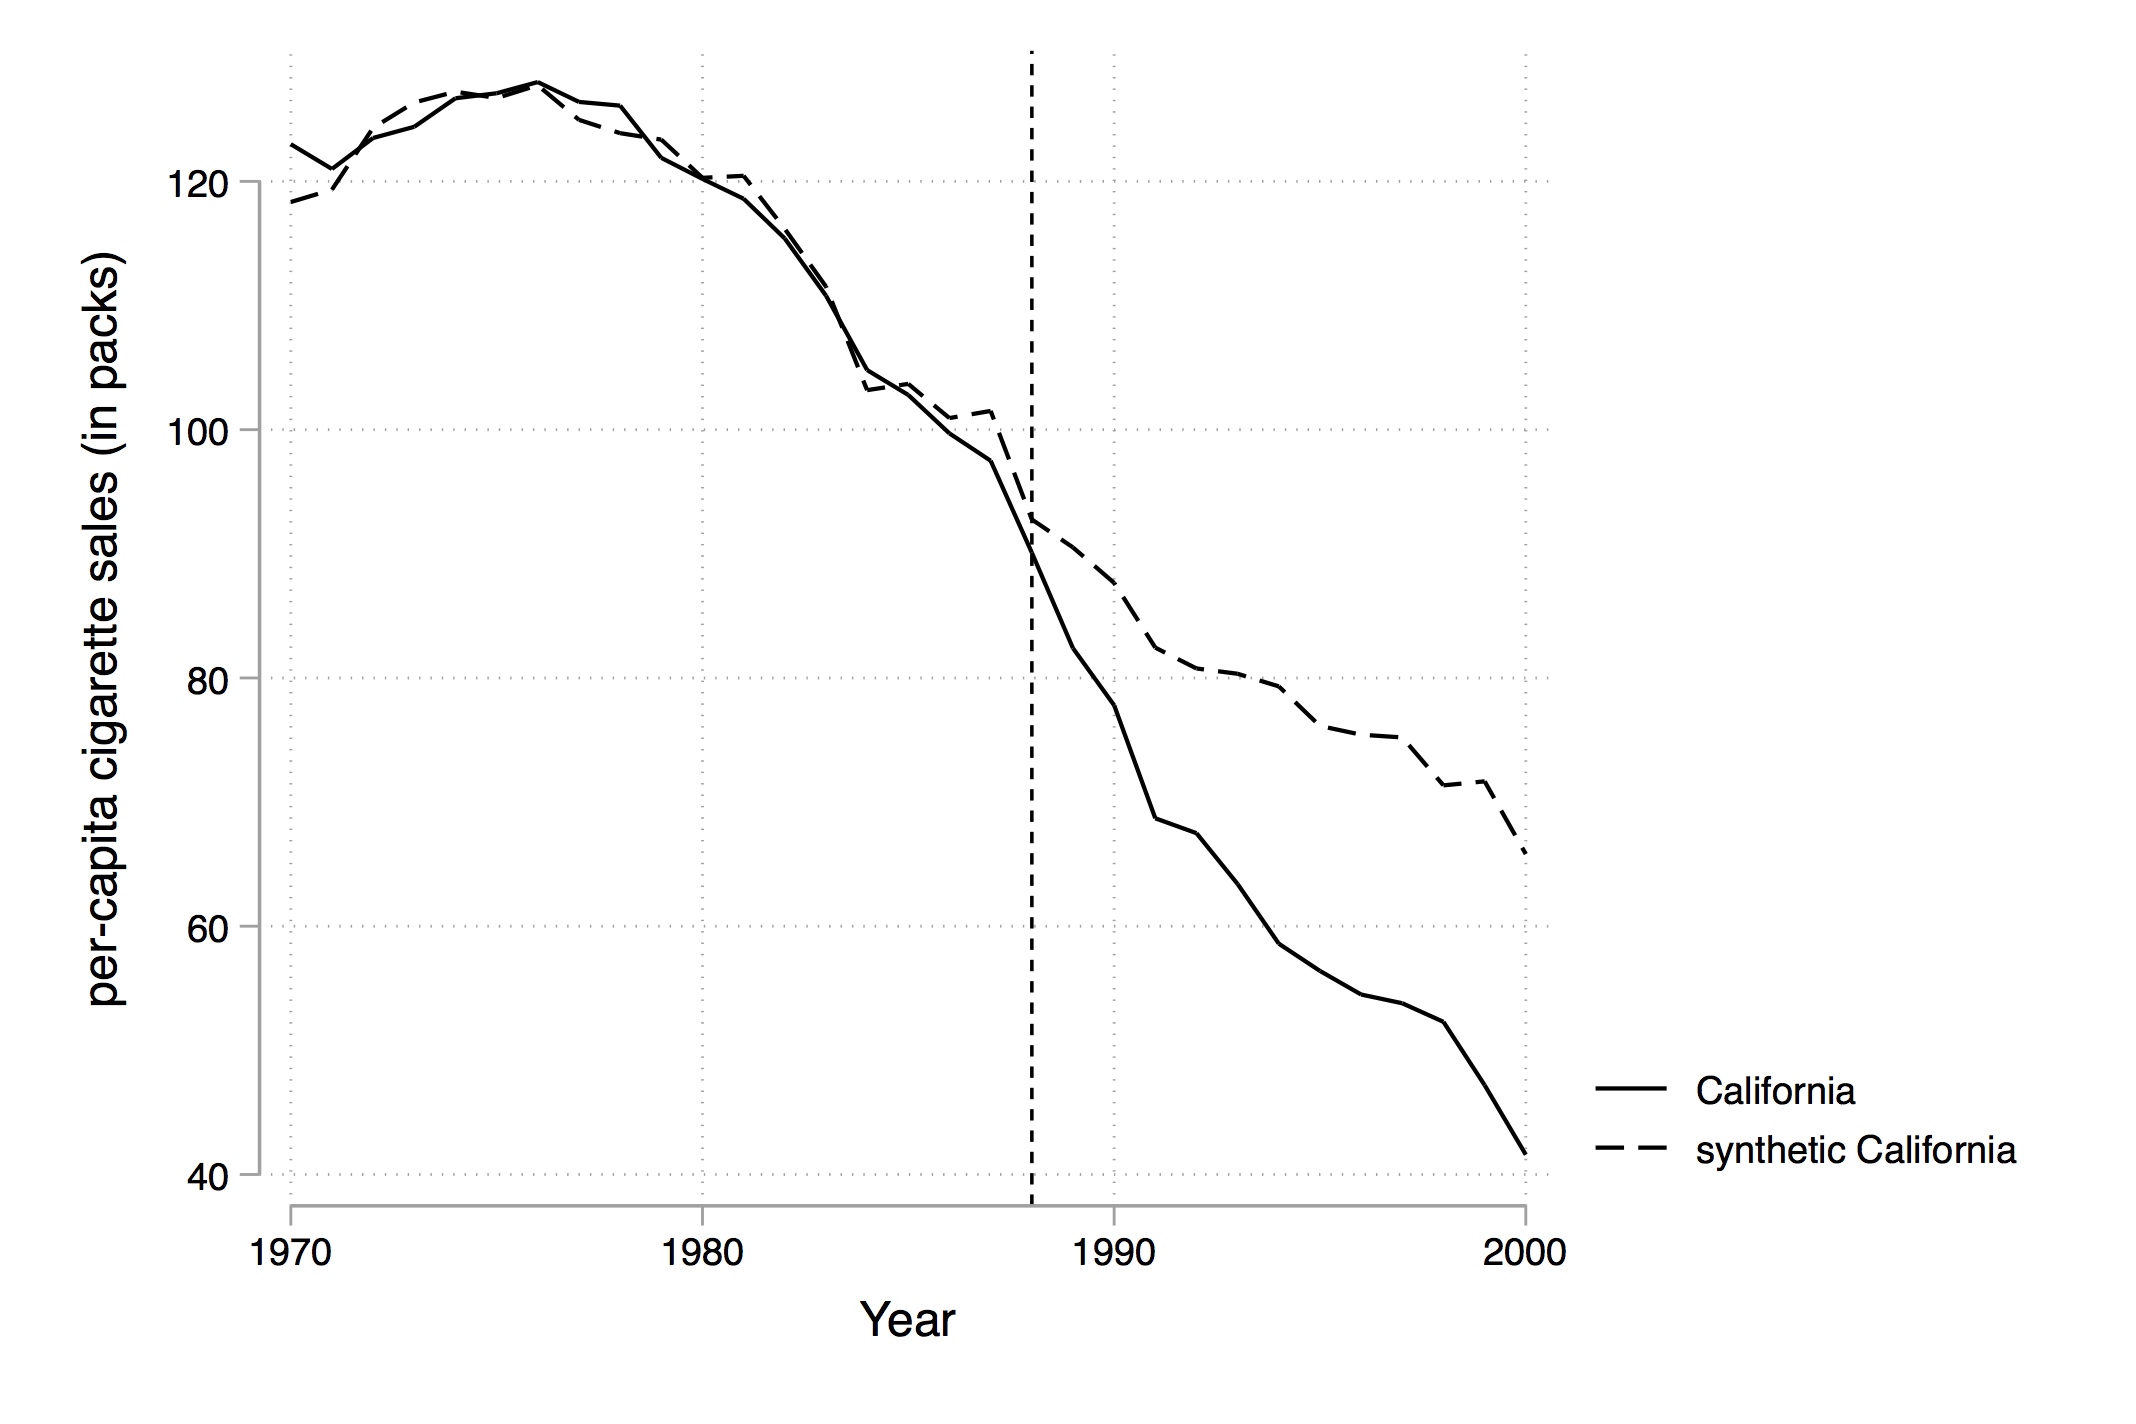
There was a trend before the treatment. How can we estimate the causal effect?

Synthetic Control

The goal is to elect an optimal set of weights that when applied to the rest of the country produces the following figure:

Synthetic Control

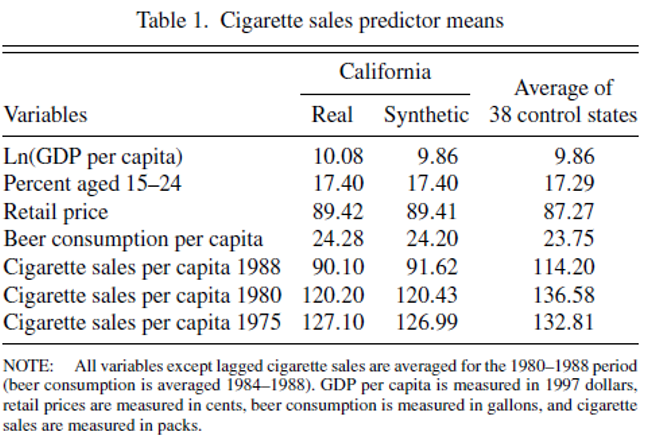
The variables used for computing the weights are the following. You are creating weights such that weighting the other states, you can create a synthetic California. Notice that, so far, the product of this analysis is only two data points per period.

Synthetic Control

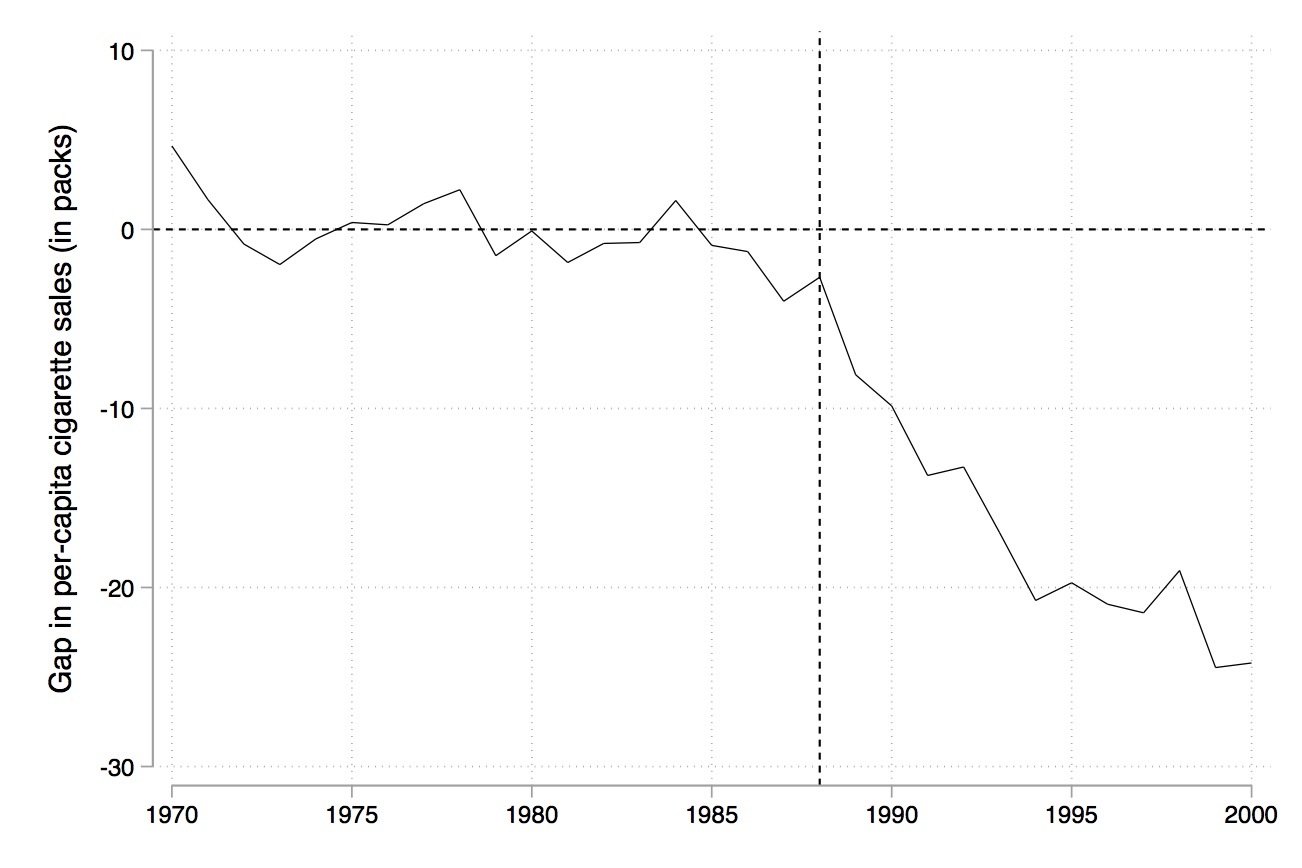
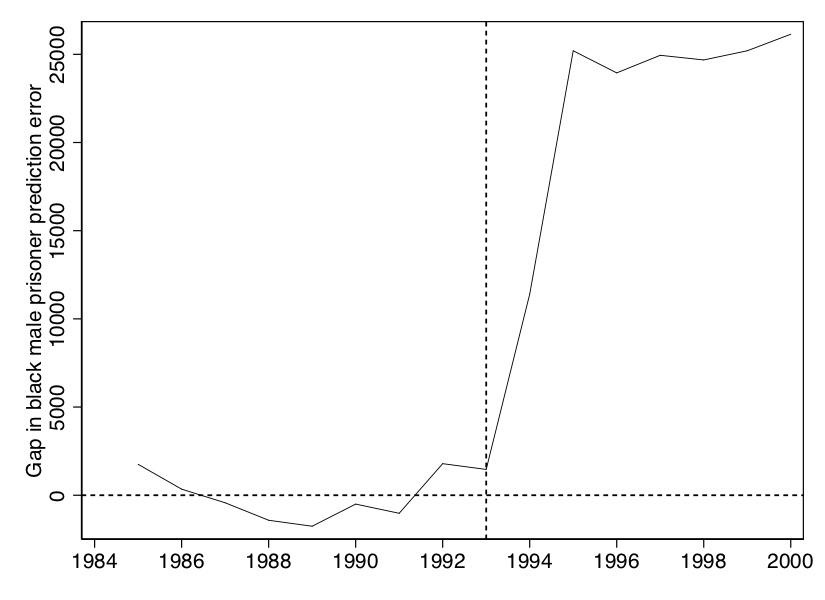
Tip: Synth is also an graphical method, so graphs like the following are common. This is the difference between the two series.

Inference

Inference

Notice that, so far, the product of this analysis is only two data points per period. How can you stablish a “significant” causal effect?

Steps

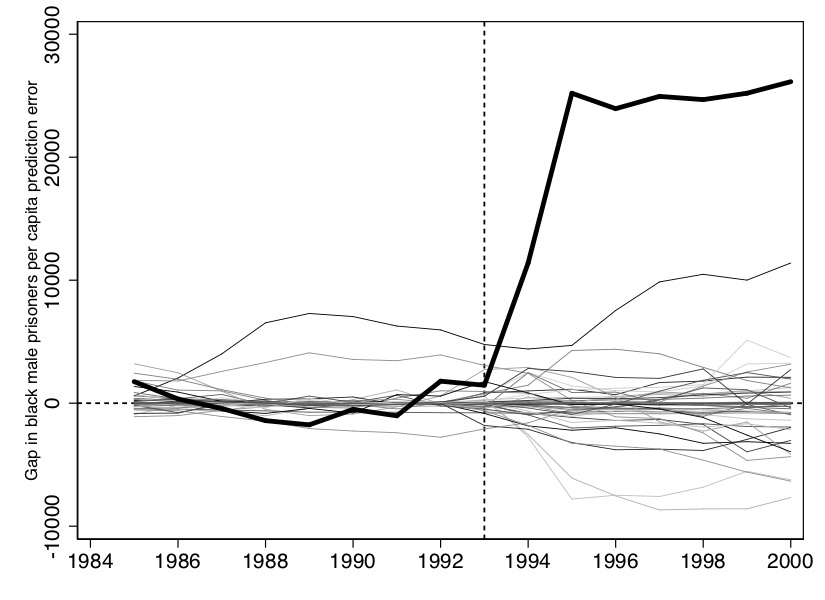
  1. Apply synth to each state in the control group (also called “donor pool”).

  2. Obtain a distribution of placebos.

  3. Compare the gap for California to the distribution of the placebo gaps.

  4. Then, test whether the effect for the treated unit is large enough relative to the placebos (i.e., to the effect estimated for a placebo unit randomly selected).

Inference

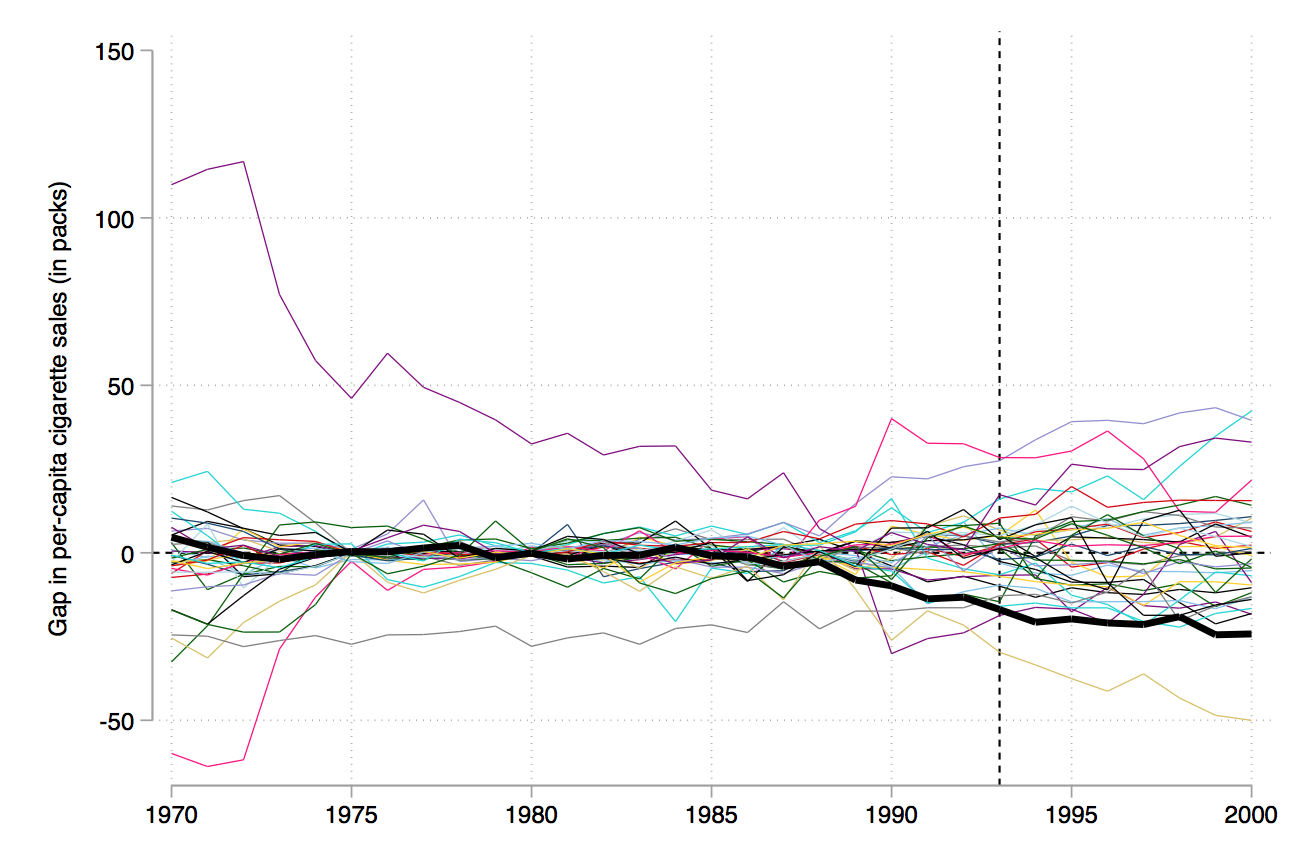
Notice the bold line (treated unit) after the treatment. It is at the bottom.

Inference

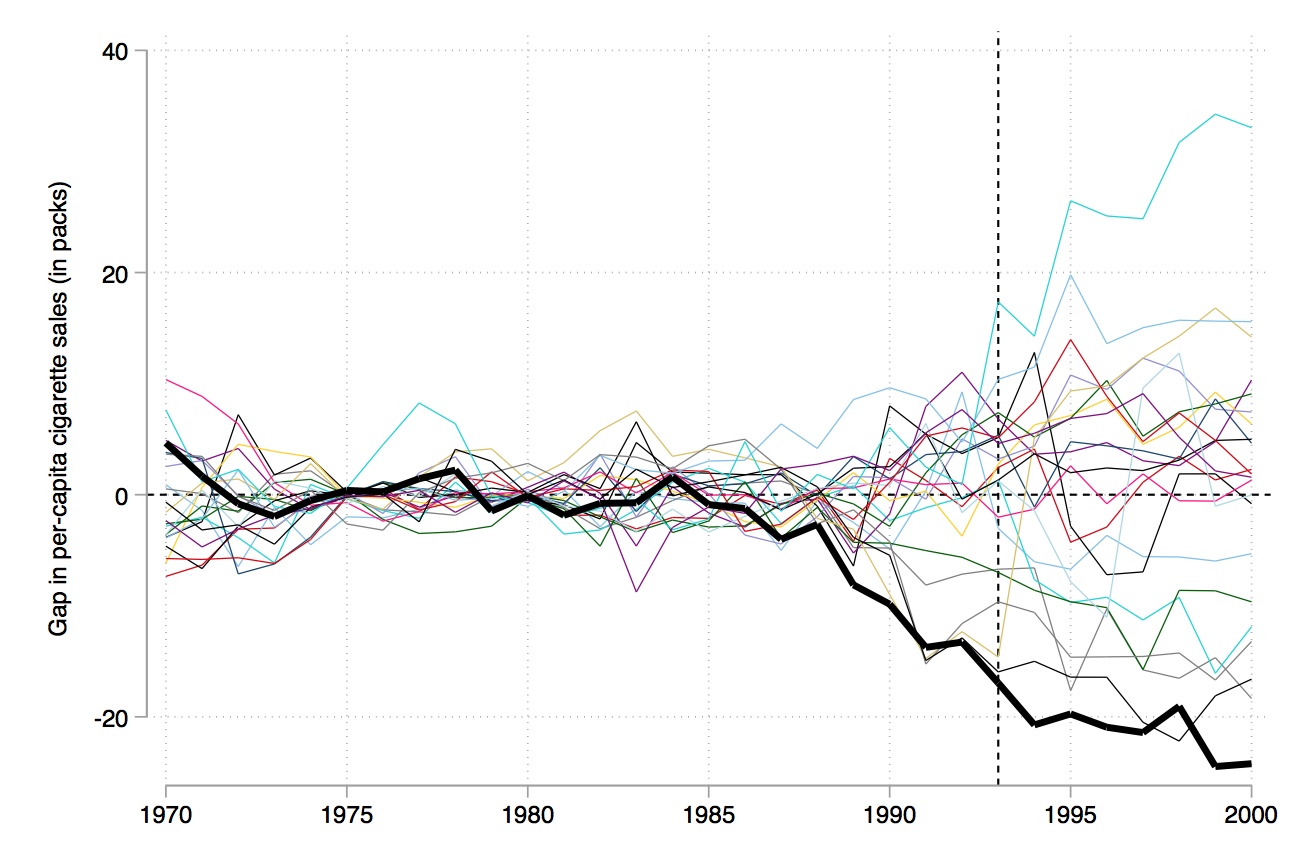
Abadie, Diamond, and Hainmueller (2010) recommend iteratively dropping the states whose pre-treatment RMSPE is considerably different than California’s because as you can see, they’re kind of blowing up the scale and making it hard to see what’s going on. Mastering Metrics

Inference

The previous figure suggests the effect is large enough relative to the placebo effects.

  1. The root mean squared prediction error (RMSPE) is:

\[RMSPE = \bigg (\dfrac{1}{T-T_0} \sum_{t=T_0+t}^T \bigg (Y_{1t} - \sum_{j=2}^{J+1} w_j^* Y_{jt} \bigg )^2 \bigg )^{\tfrac{1}{2}}\]

It shows how far predictions fall from measured true values using Euclidean distance.

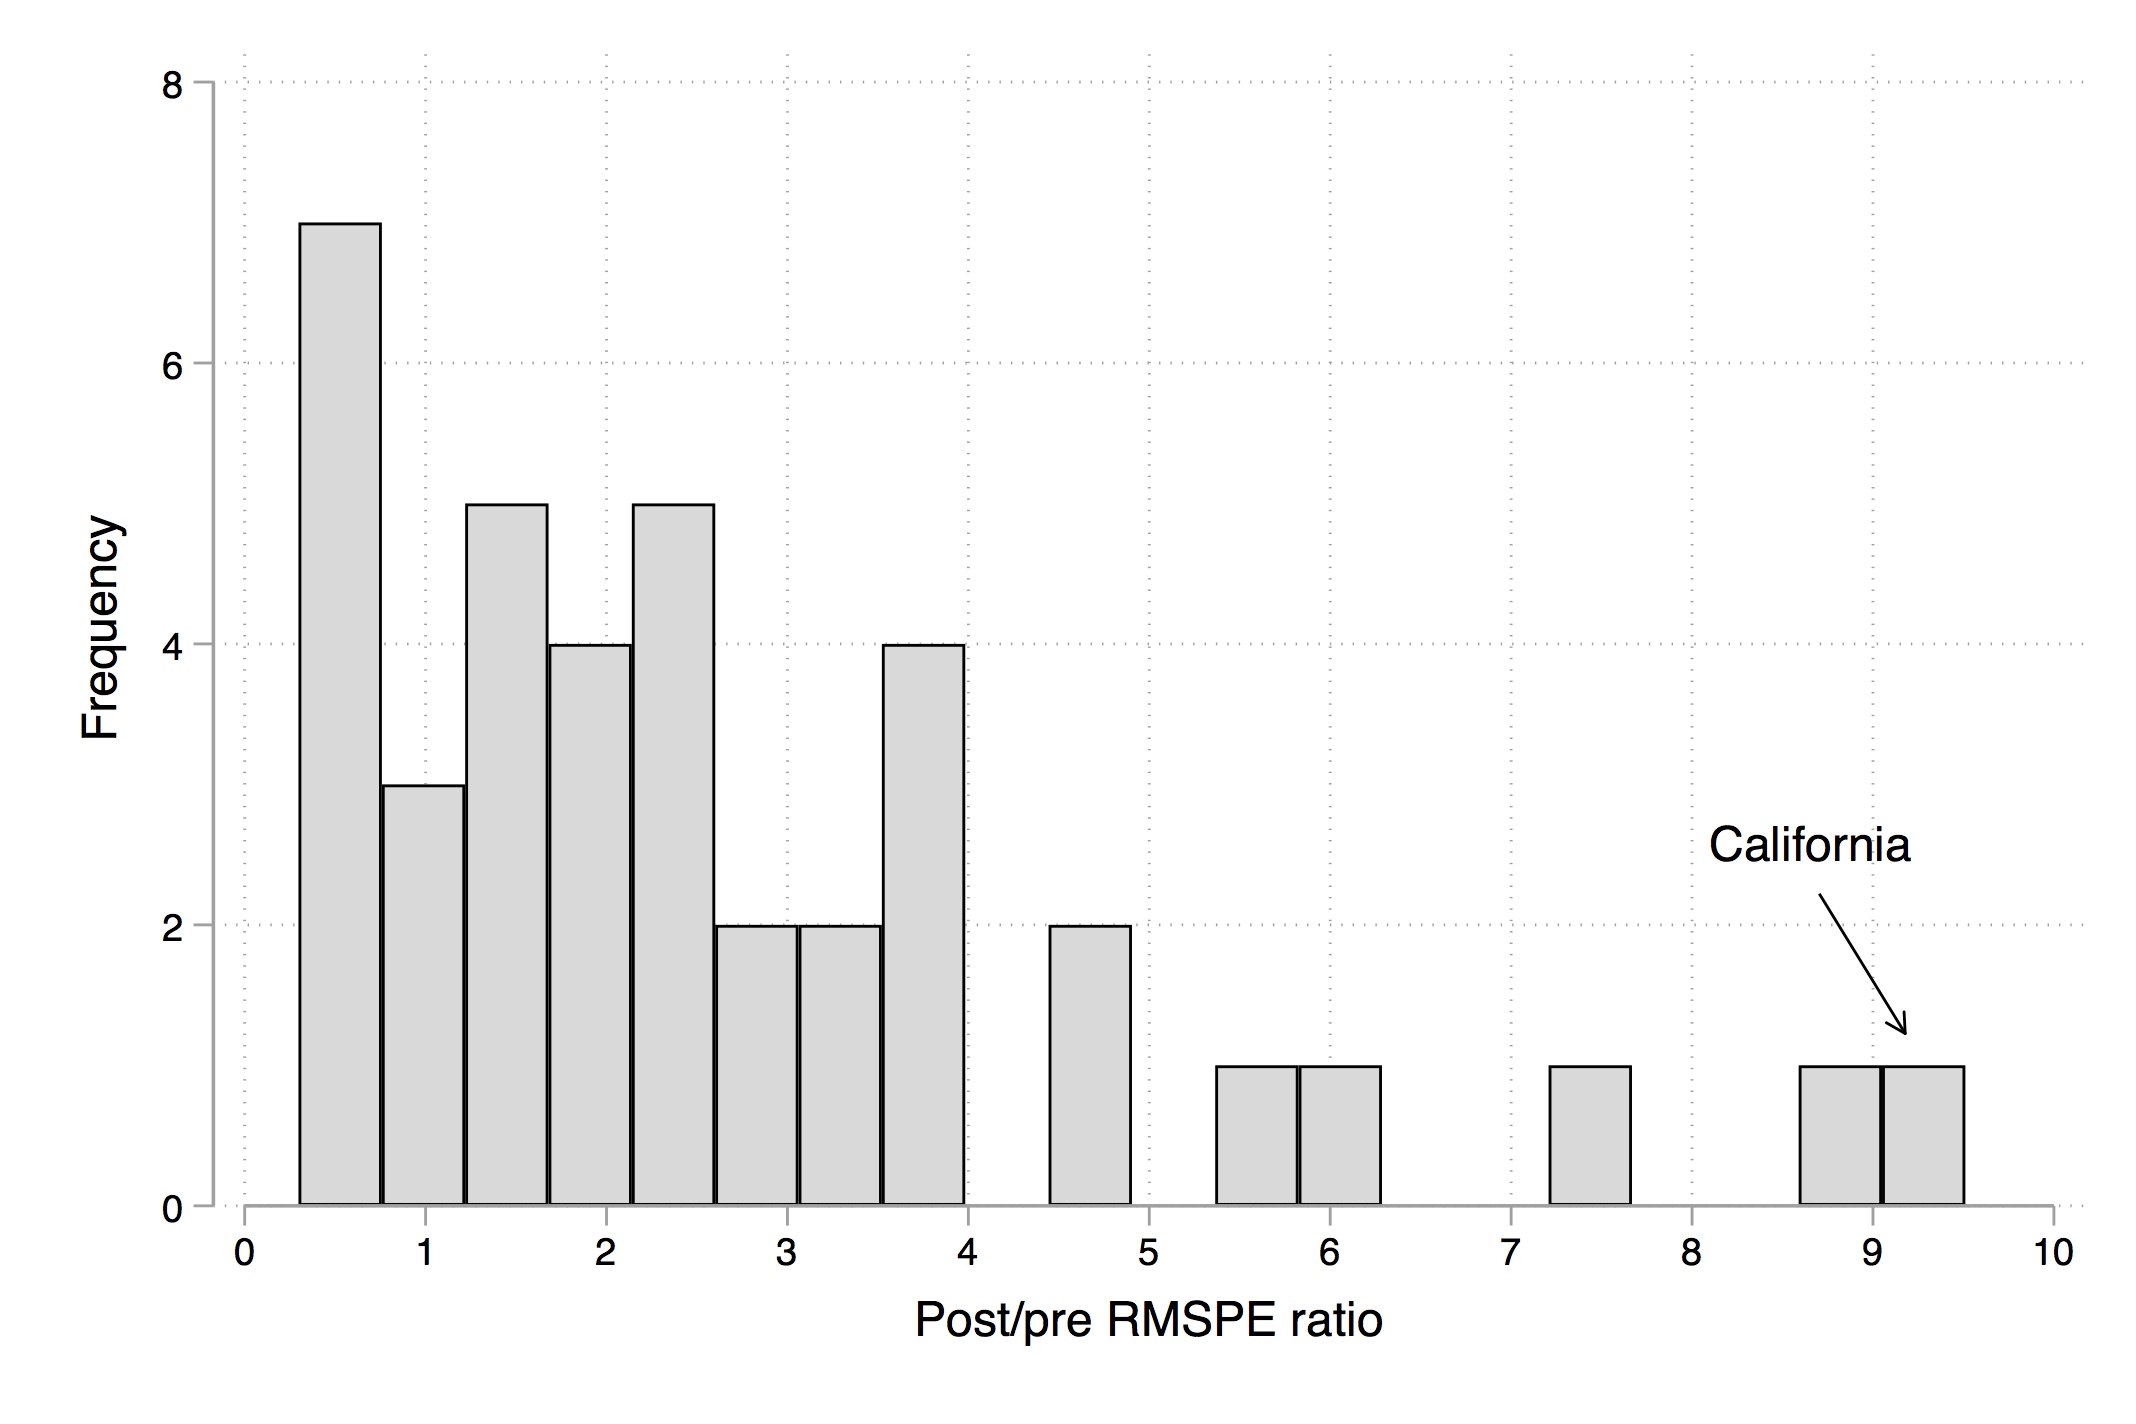
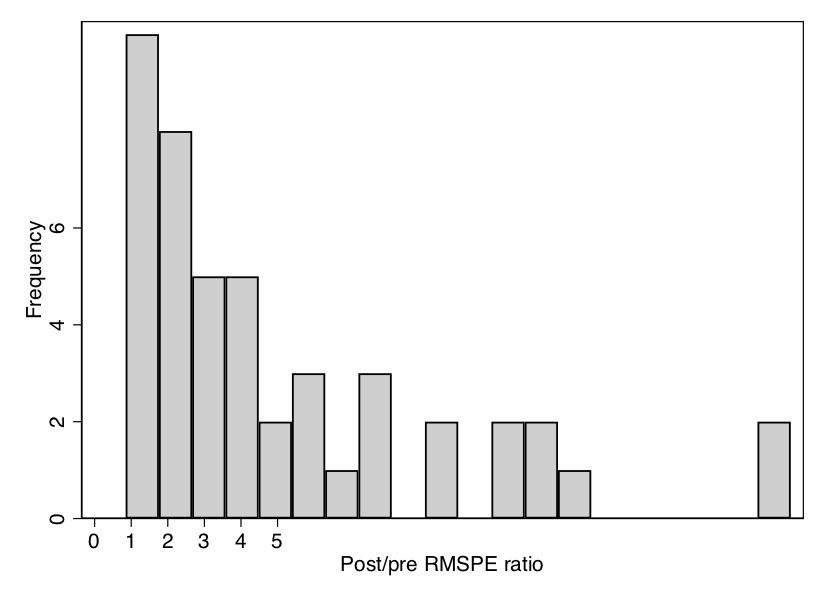
  1. Sort the ratio post- to pre-treatment RMSPE in descending order

  2. Calculate the p-value as \(\frac{Rank}{Total}\).

Basically, these steps give how likely is the occurrence of the treated unit distance vis-a-vis the average placebo.

Inference

RMSPE: in the previous example, California has the largest increase in the error after the treatment. Position 1 out of 39 states, implying an exact p-value of \(\frac{1}{38}=0.026\) (significant).

Example Synth

Example Synth

Stata
use files/synth_smoking.dta , clear
tsset state year
synth cigsale beer(1984(1)1988) lnincome retprice age15to24 cigsale(1988) cigsale(1980) cigsale(1975), trunit(3) trperiod(1989) 
(Tobacco Sales in 39 US States)


Panel variable: state (strongly balanced)
 Time variable: year, 1970 to 2000
         Delta: 1 unit

-------------------------------------------------------------------------------
Synthetic Control Method for Comparative Case Studies
-------------------------------------------------------------------------------

First Step: Data Setup
-------------------------------------------------------------------------------
control units: for 38 of out 38 units missing obs for predictor lnincome in per
> iod 1970 -ignored for averaging
control units: for 38 of out 38 units missing obs for predictor lnincome in per
> iod 1971 -ignored for averaging
treated unit: for 1 of out 1 units missing obs for predictor lnincome in period
>  1970 -ignored for averaging
treated unit: for 1 of out 1 units missing obs for predictor lnincome in period
>  1971 -ignored for averaging
-------------------------------------------------------------------------------
Data Setup successful
-------------------------------------------------------------------------------
                Treated Unit: California
               Control Units: Alabama, Arkansas, Colorado, Connecticut,
                              Delaware, Georgia, Idaho, Illinois, Indiana,
                              Iowa, Kansas, Kentucky, Louisiana, Maine,
                              Minnesota, Mississippi, Missouri, Montana,
                              Nebraska, Nevada, New Hampshire, New Mexico,
                              North Carolina, North Dakota, Ohio, Oklahoma,
                              Pennsylvania, Rhode Island, South Carolina, South
                              Dakota, Tennessee, Texas, Utah, Vermont,
                              Virginia, West Virginia, Wisconsin, Wyoming
-------------------------------------------------------------------------------
          Dependent Variable: cigsale
  MSPE minimized for periods: 1970 1971 1972 1973 1974 1975 1976 1977 1978 1979
                              1980 1981 1982 1983 1984 1985 1986 1987 1988
Results obtained for periods: 1970 1971 1972 1973 1974 1975 1976 1977 1978 1979
                              1980 1981 1982 1983 1984 1985 1986 1987 1988 1989
                              1990 1991 1992 1993 1994 1995 1996 1997 1998 1999
                              2000
-------------------------------------------------------------------------------
                  Predictors: beer(1984(1)1988) lnincome retprice age15to24
                              cigsale(1988) cigsale(1980) cigsale(1975)
-------------------------------------------------------------------------------
Unless period is specified
predictors are averaged over: 1970 1971 1972 1973 1974 1975 1976 1977 1978 1979
                              1980 1981 1982 1983 1984 1985 1986 1987 1988
-------------------------------------------------------------------------------

Second Step: Run Optimization
-------------------------------------------------------------------------------
-------------------------------------------------------------------------------
Optimization done
-------------------------------------------------------------------------------

Third Step: Obtain Results
-------------------------------------------------------------------------------
Loss: Root Mean Squared Prediction Error

---------------------
   RMSPE |  1.943233 
---------------------
-------------------------------------------------------------------------------
Unit Weights:

----------------------------
         Co_No | Unit_Weight
---------------+------------
       Alabama |           0
      Arkansas |           0
      Colorado |        .285
   Connecticut |        .101
      Delaware |           0
       Georgia |           0
         Idaho |           0
      Illinois |           0
       Indiana |           0
          Iowa |           0
        Kansas |           0
      Kentucky |           0
     Louisiana |           0
         Maine |           0
     Minnesota |           0
   Mississippi |           0
      Missouri |           0
       Montana |           0
      Nebraska |           0
        Nevada |        .245
 New Hampshire |           0
    New Mexico |           0
North Carolina |           0
  North Dakota |           0
          Ohio |           0
      Oklahoma |           0
  Pennsylvania |           0
  Rhode Island |           0
South Carolina |           0
  South Dakota |           0
     Tennessee |           0
         Texas |           0
          Utah |        .369
       Vermont |           0
      Virginia |           0
 West Virginia |           0
     Wisconsin |           0
       Wyoming |           0
----------------------------
-------------------------------------------------------------------------------
Predictor Balance:

------------------------------------------------------
                               |   Treated  Synthetic 
-------------------------------+----------------------
             beer(1984(1)1988) |     24.28   23.22596 
                      lnincome |  10.03176   9.867266 
                      retprice |  66.63684   65.40743 
                     age15to24 |  .1786624   .1825559 
                 cigsale(1988) |      90.1    92.6063 
                 cigsale(1980) |     120.2   120.3907 
                 cigsale(1975) |     127.1   126.7094 
------------------------------------------------------
-------------------------------------------------------------------------------

counter | pri_inf  | dual_inf  | pri_obj   | dual_obj  | sigfig | alpha  | nu 
----------------------------------------------------------------------------------
      0 | 8.29e+001 | 7.80e-006 | -1.26e+001 | -3.93e+002 |  0.000 | 0.0000 | 1.00e+002
      1 | 5.04e-001 | 4.74e-008 | -1.26e+001 | -7.02e+002 |  0.000 | 0.9939 | 3.05e-005
      2 | 2.85e-003 | 2.68e-010 | -1.25e+001 | -2.80e+001 |  0.000 | 0.9943 | 2.70e-006
      3 | 1.60e-004 | 1.51e-011 | -1.26e+001 | -1.34e+001 |  1.193 | 0.9438 | 5.40e-006
      4 | 1.57e-005 | 1.47e-012 | -1.26e+001 | -1.27e+001 |  2.000 | 0.9022 | 9.21e-007
      5 | 9.72e-006 | 9.13e-013 | -1.26e+001 | -1.27e+001 |  2.207 | 0.3806 | 6.37e-006
      6 | 2.91e-006 | 2.73e-013 | -1.26e+001 | -1.26e+001 |  2.714 | 0.7006 | 8.69e-007
      7 | 5.05e-007 | 4.75e-014 | -1.26e+001 | -1.26e+001 |  3.414 | 0.8263 | 8.90e-008
      8 | 1.70e-007 | 1.60e-014 | -1.26e+001 | -1.26e+001 |  3.881 | 0.6640 | 6.85e-008
      9 | 2.24e-008 | 2.10e-015 | -1.26e+001 | -1.26e+001 |  4.685 | 0.8682 | 3.46e-009
     10 | 2.57e-010 | 2.43e-017 | -1.26e+001 | -1.26e+001 |  6.512 | 0.9885 | 4.02e-012
     11 | 1.28e-012 | 1.87e-018 | -1.26e+001 | -1.26e+001 |  8.807 | 0.9950 | 1.14e-014
     12 | 6.45e-015 | 1.86e-018 | -1.26e+001 | -1.26e+001 | 11.104 | 0.9950 | 5.78e-017
     13 | 8.88e-016 | 2.02e-018 | -1.26e+001 | -1.26e+001 | 13.407 | 0.9950 | 2.91e-019
----------------------------------------------------------------------------------
optimization converged
Example Synth

Stata
use files/synth_smoking.dta , clear
synth cigsale beer lnincome(1980&1985) retprice cigsale(1988) cigsale(1980) cigsale(1975), trunit(3) trperiod(1989) fig
quietly graph export figs/synth1.svg, replace

Example Synth

Authors using synthetic control must do more than merely run the synth command when doing comparative case studies.

They must find the exact-values through placebo-based inference, check for the quality of the pre-treatment fit, investigate the balance of the covariates used for matching, and check for the validity of the model through placebo estimation (e.g., rolling back the treatment date).

Mastering Metrics

Mastering Metrics

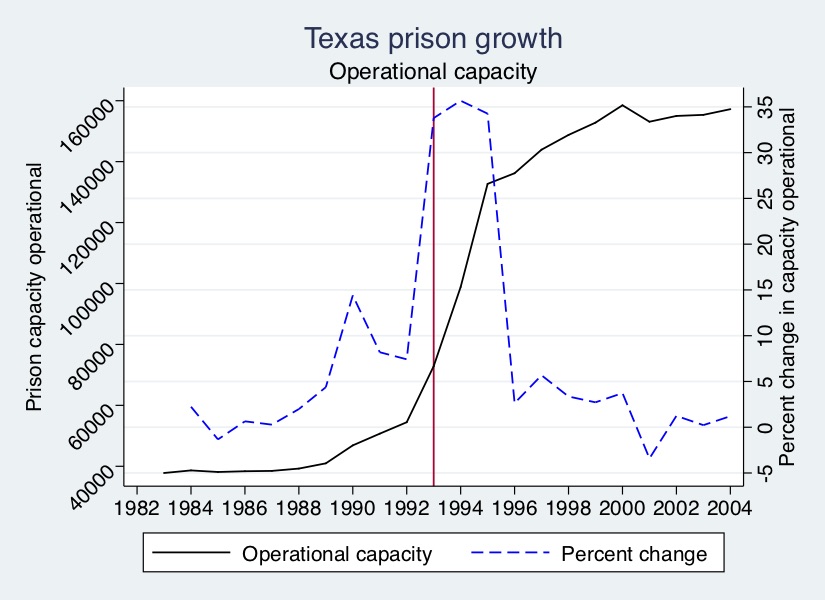
In 1992, Texas expanded the prision system operational capacity.

Mastering Metrics

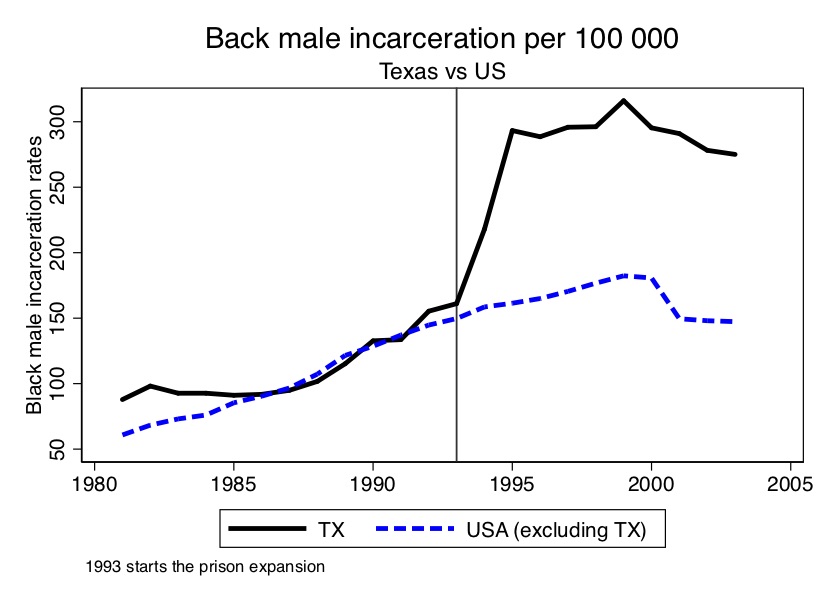
This is what happened.

Mastering Metrics

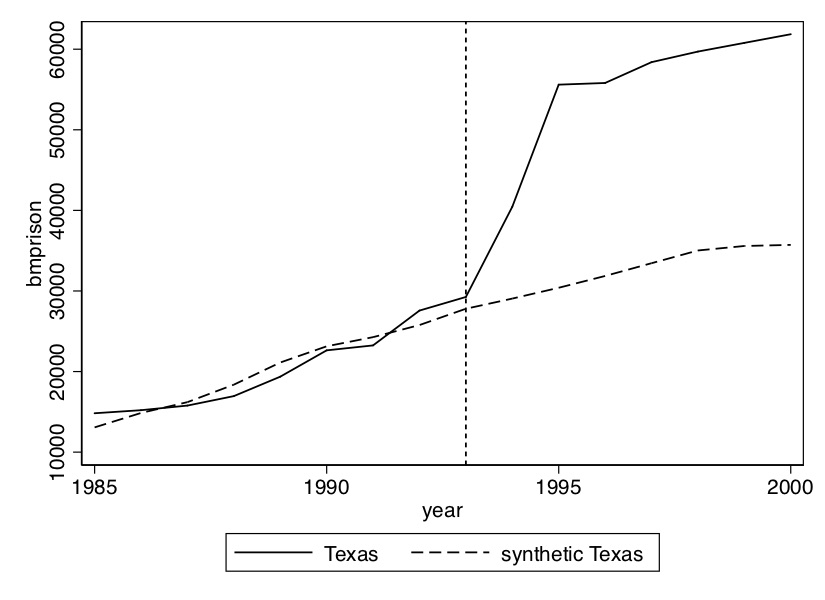
Synthetic Texas.

Mastering Metrics

Gap between Synthetic Texas and Texas.

Mastering Metrics

Building Placebos.

Mastering Metrics

Texas is the one in the far right tail.

THANK YOU!

QUESTIONS?