library(ggplot2)
library(ggthemes)
library(downloader)
library(haven)
url <- "https://info.worldbank.org/governance/wgi/Home/downLoadFile?fileName=wgidataset_stata.zip"
download(url, dest="file.zip", mode="wb")
unzip ("file.zip", exdir = "./")
data <- read_dta("wgidataset.dta")
file.remove("file.zip")
file.remove("PublicStataDatasetReadme.pdf")
file.remove("wgidataset.dta")Worldwide Governance Indicators
Open Data
Open Code
Brazil
Corruption
Graphing WGI
There is one dataset that I like a lot: the Worldwide Governance Indicators (WGI) project. It contains data since 1996 about the governance of all countries. Governance here is measured by the six following variables:
- Voice and Accountability
- Political Stability and Absence of Violence
- Government Effectiveness
- Regulatory Quality
- Rule of Law
- Control of Corruption
Before we continue, it is important to know what these variables are measuring: they measure Brazilians’ perception about governance, they do not measure governance per se. Thus, the Government Effectiveness variable, for instance, represents how effective Brazilians believe their Government are, not whether the Government is really effective or not. Perception here is the crucial word, so let’s keep that in mind.
Also, the six variables are measured on a scale from -2.5 to 2.5. The higher the number, the “better” or the more “optimistic” the society of that country is about that variable.
First, download the data.
For convenience, let’s focus only on the years after 2000 and in some selected countries.
names(data)[names(data) == 'countryname'] <- 'Country'
data <-subset(data, year >= 2000)
countries <- as.data.frame(c("Brazil", "France", "Germany", "United States of America", "United Kingdom", "Italy", "Japan", "China", "India"))
colnames(countries) <- "Country"
data <- merge(data, countries , by="Country")
Now let’s have fun visualizing data. More about the clarifications in : https://info.worldbank.org/governance/wgi/Home/Documents
Voice and Accountability (vae)
Description: Voice and accountability captures perceptions of the extent to which a country’s citizens are able to participate in selecting their government, as well as freedom of expression, freedom of association, and a free media.
ggplot(data, aes(x = year, y=vae) ) +   geom_line(aes(colour = Country)) +
  labs(y='Voice and Accountability',
       x='Year',
       title = "Voice and Accountability (selected countries since 2000)",
       caption = "Source: https://info.worldbank.org/governance/wgi/") + theme_solarized() +
  theme(legend.position = "none") +
  ggrepel::geom_text_repel(data = data[which(data$year == 2020),], aes(label = Country) , size = 2.5 ,  max.overlaps = Inf)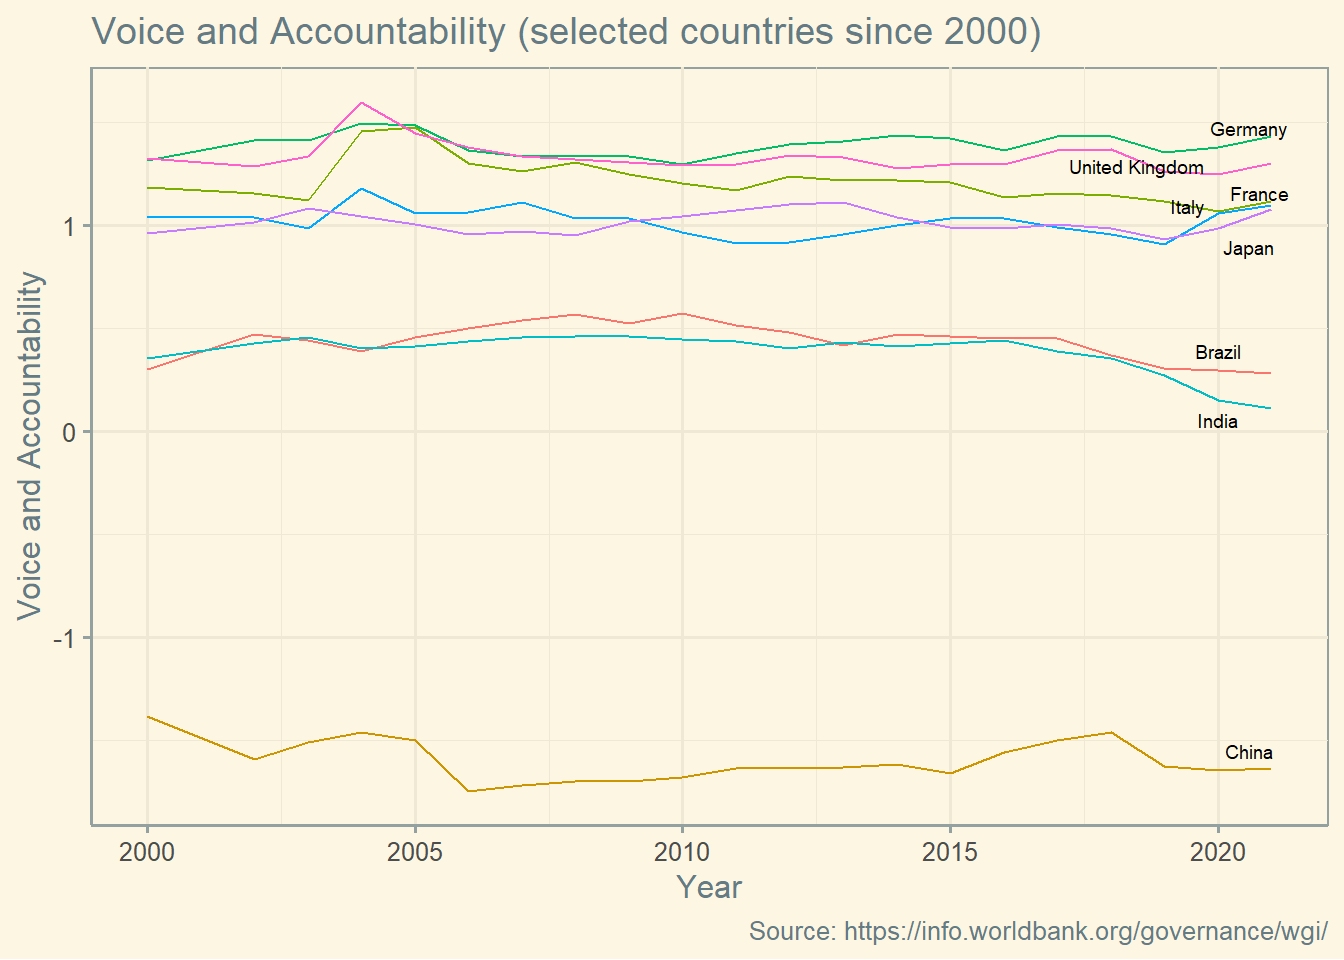
Political Stability and Absence of Violence/Terrorism (pve)
Description: Political Stability and Absence of Violence/Terrorism measures perceptions of the likelihood of political instability and/or politicallymotivated violence, including terrorism.
ggplot(data, aes(x = year, y=pve) ) +   geom_line(aes(colour = Country)) +
  labs(y='Pol. Stability and Absence of Viol./Terror.',
       x='Year',
       title = "Pol. Stability and Absence of Viol./Terror. (selected countries since 2000)",
       caption = "Source: https://info.worldbank.org/governance/wgi/") + theme_solarized() +
  theme(legend.position = "none") +
  ggrepel::geom_text_repel(data = data[which(data$year == 2020),], aes(label = Country) , size = 2.5 ,  max.overlaps = Inf)
Government Effectiveness (gee)
Description: Government effectiveness captures perceptions of the quality of public services, the quality of the civil service and the degree of its independence from political pressures, the quality of policy formulation and implementation, and the credibility of the government’s commitment to such policies..
ggplot(data, aes(x = year, y=gee) ) +   geom_line(aes(colour = Country)) +
  labs(y='Government Effectiveness',
       x='Year',
       title = "Government Effectiveness (selected countries since 2000)",
       caption = "Source: https://info.worldbank.org/governance/wgi/") + theme_solarized() +
  theme(legend.position = "none") +
  ggrepel::geom_text_repel(data = data[which(data$year == 2020),], aes(label = Country) , size = 2.5 ,  max.overlaps = Inf)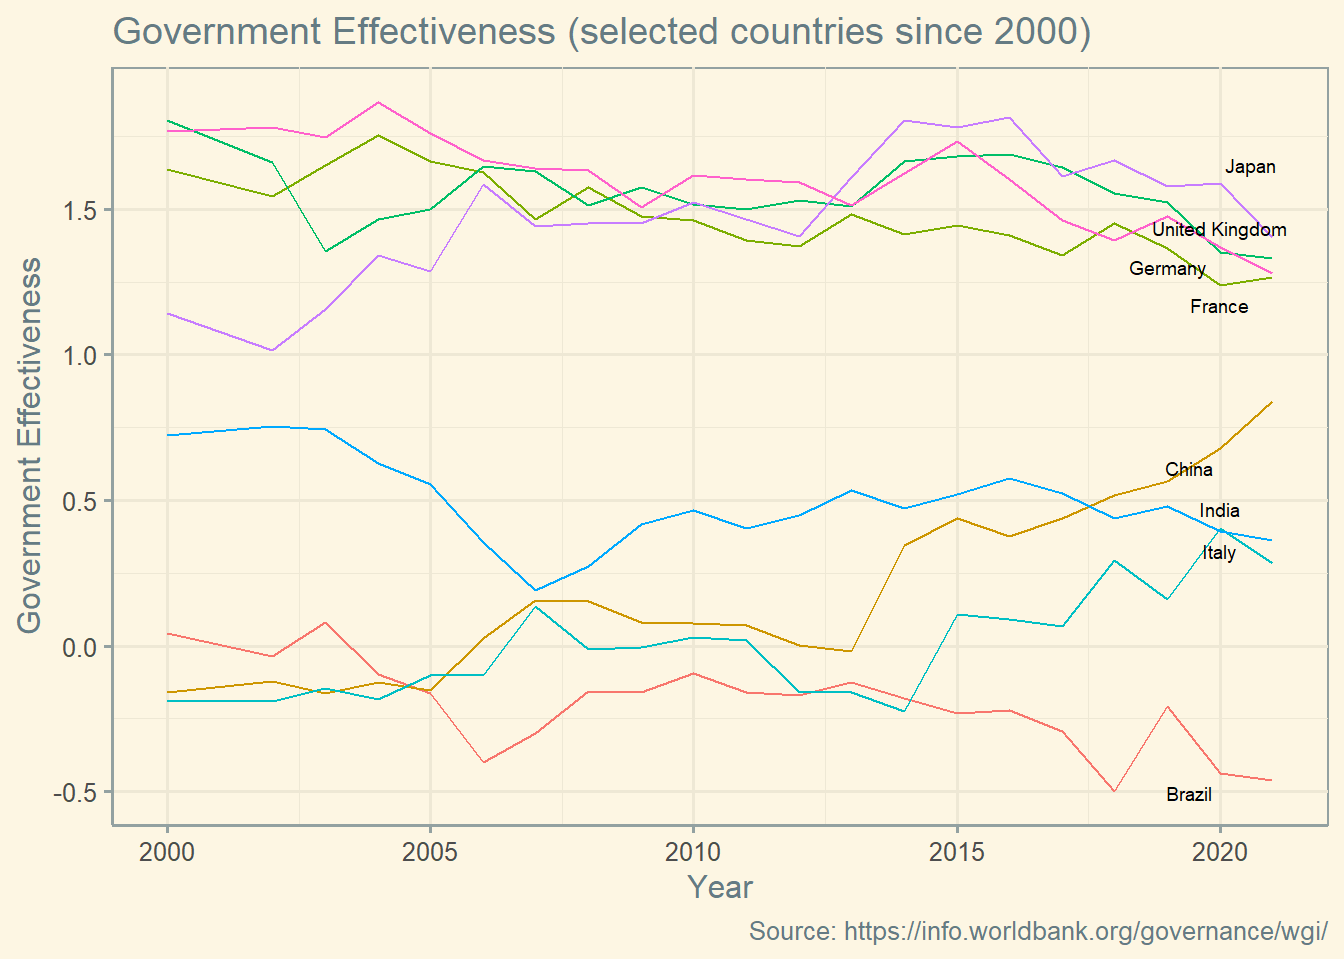
Regulatory Quality (rqe)
Description: Regulatory quality captures perceptions of the ability of the government to formulate and implement sound policies and regulations that permit and promote private sector development.
ggplot(data, aes(x = year, y=rqe) ) +   geom_line(aes(colour = Country)) +
  labs(y='Regulatory Quality',
       x='Year',
       title = "Regulatory Quality (selected countries since 2000)",
       caption = "Source: https://info.worldbank.org/governance/wgi/") + theme_solarized() +
  theme(legend.position = "none") +
  ggrepel::geom_text_repel(data = data[which(data$year == 2020),], aes(label = Country) , size = 2.5 ,  max.overlaps = Inf)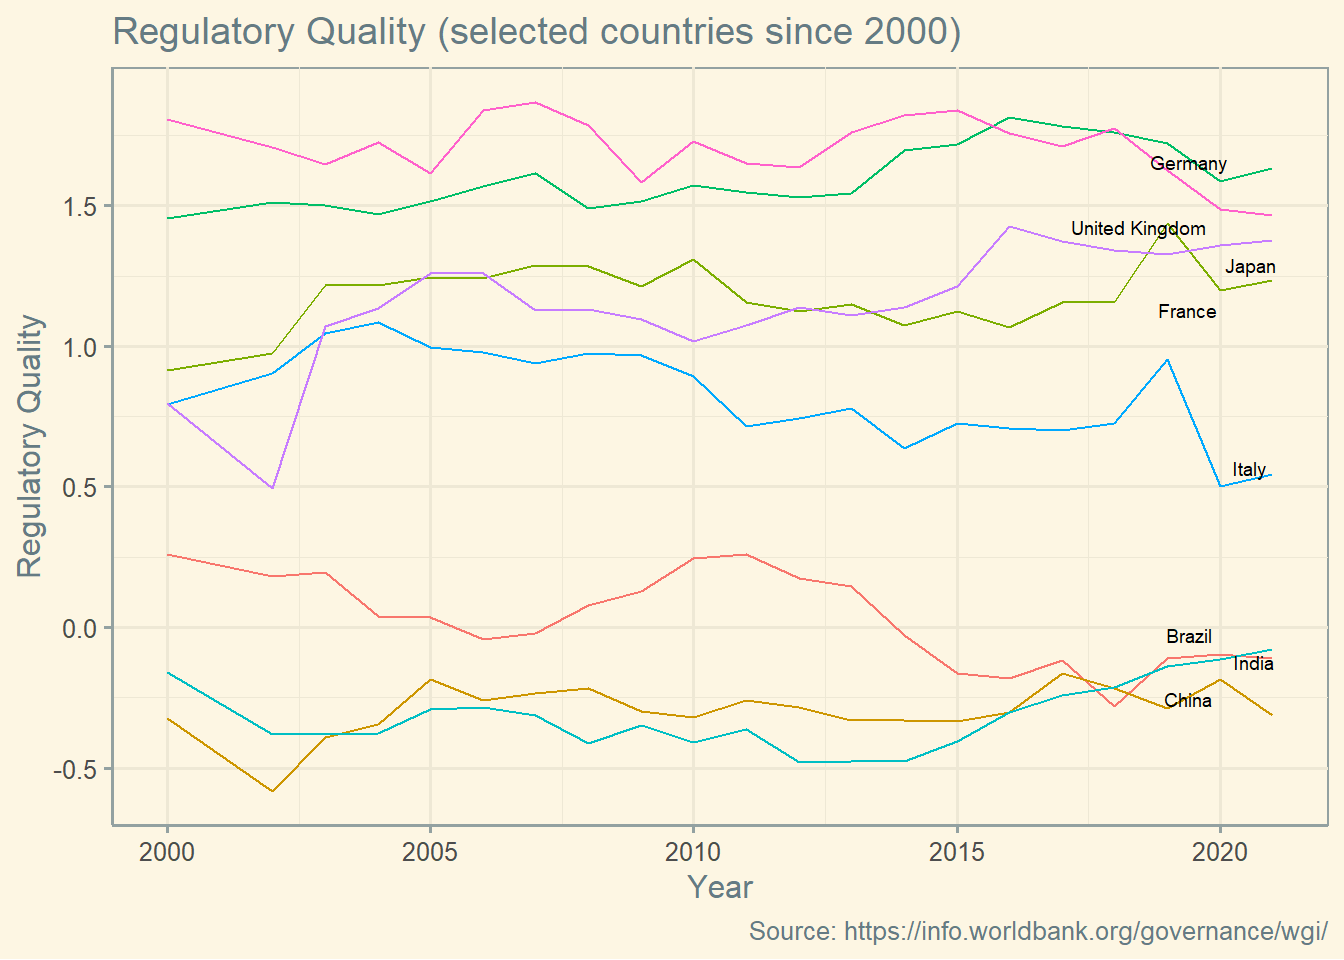
Rule of Law (rle)
Description: Rule of law captures perceptions of the extent to which agents have confidence in and abide by the rules of society, and in particular the quality of contract enforcement, property rights, the police, and the courts, as well as the likelihood of crime and violence.
ggplot(data, aes(x = year, y=rle) ) +   geom_line(aes(colour = Country)) +
  labs(y='Rule of Law',
       x='Year',
       title = "Rule of Law (selected countries since 2000)",
       caption = "Source: https://info.worldbank.org/governance/wgi/") + theme_solarized() +
  theme(legend.position = "none") +
  ggrepel::geom_text_repel(data = data[which(data$year == 2020),], aes(label = Country) , size = 2.5 ,  max.overlaps = Inf)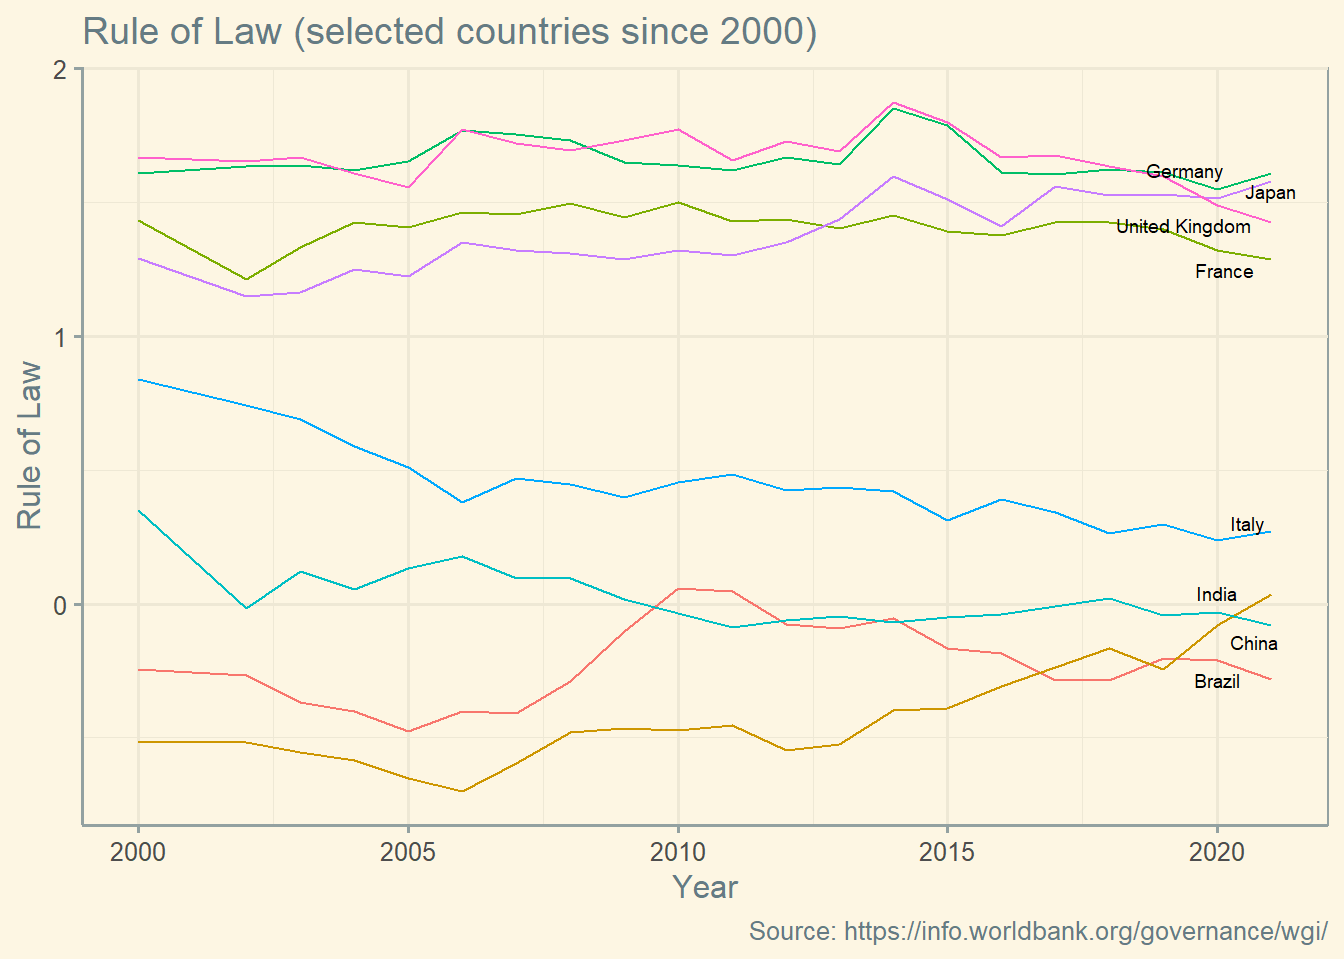
Control of Corruption (cce)
Description: Control of corruption captures perceptions of the extent to which public power is exercised for private gain, including both petty and grand forms of corruption, as well as “capture” of the state by elites and private interests.
ggplot(data, aes(x = year, y=cce) ) +   geom_line(aes(colour = Country)) +
  labs(y='Control of Corruption',
       x='Year',
       title = "Control of Corruption (selected countries since 2000)",
       caption = "Source: https://info.worldbank.org/governance/wgi/") + theme_solarized() +
  theme(legend.position = "none") +
  ggrepel::geom_text_repel(data = data[which(data$year == 2020),], aes(label = Country) , size = 2.5 ,  max.overlaps = Inf)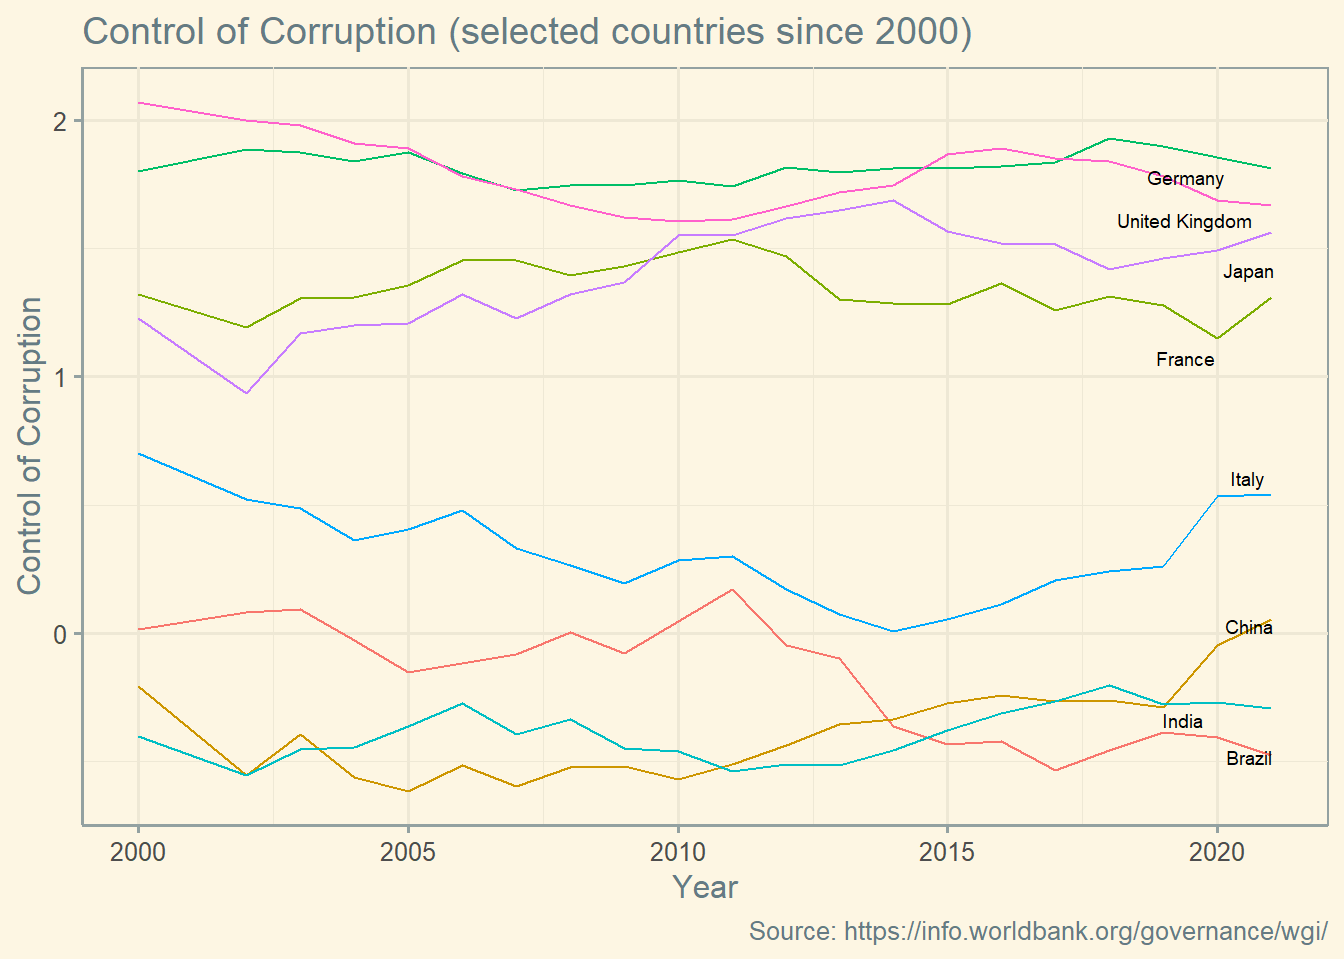
Thanks for passing by!