library(ipeadatar)Ibovespa in USD
Finance
Open Data
Open Code
Graphing Ibovespa in dollar using ipeadatar
Let’s see how to create a graph of Ibovespa in dollar using data from ipeadata. Start by installing and loading the following package.
Then, download the data. You will need the variables’ codes. You can use the row below to see the codes of all variables available.
all_series <- available_series()Then, after learning the codes for the variables we want (i.e., the codes ‘GM366_IBVSP366’ and ‘GM366_ERC366’ below), you download the data.
ibov  <- ipeadata(code = "GM366_IBVSP366")
dolar <- ipeadata(code = "GM366_ERC366")
See that the period available is different for the two variables.
For convenience, let’s delete some columns in Ibov and integrate the dollar to Ibov.
ibov <-subset(ibov, select=-c(tcode,uname))
dolar<-subset(dolar, select=-c(tcode,uname))
The next step is to join the data by date to avoid using different periods in each dataframe.
data <- merge(ibov,dolar, by = "date")Then, let’s calculate the ratio between Ibovespa and dollar each day.
data$ibov_dolar <- (data$value.x/data$value.y)Lastly, you are good to go, and you can create a graph as follows.
library(ggplot2)
library(ggthemes)
ggplot(data) +   geom_line(aes(x = date, y=ibov_dolar, colour="Ibov USD") ) +   geom_line(aes(x = date, y=value.x, colour="Ibov") ) +
  labs(y='Ibov in USD',
       title = "Graph of Ibov in USD (Period: since 1994)",
       caption = "Source: Ipeadata (R package: ipeadatar)") + theme_solarized()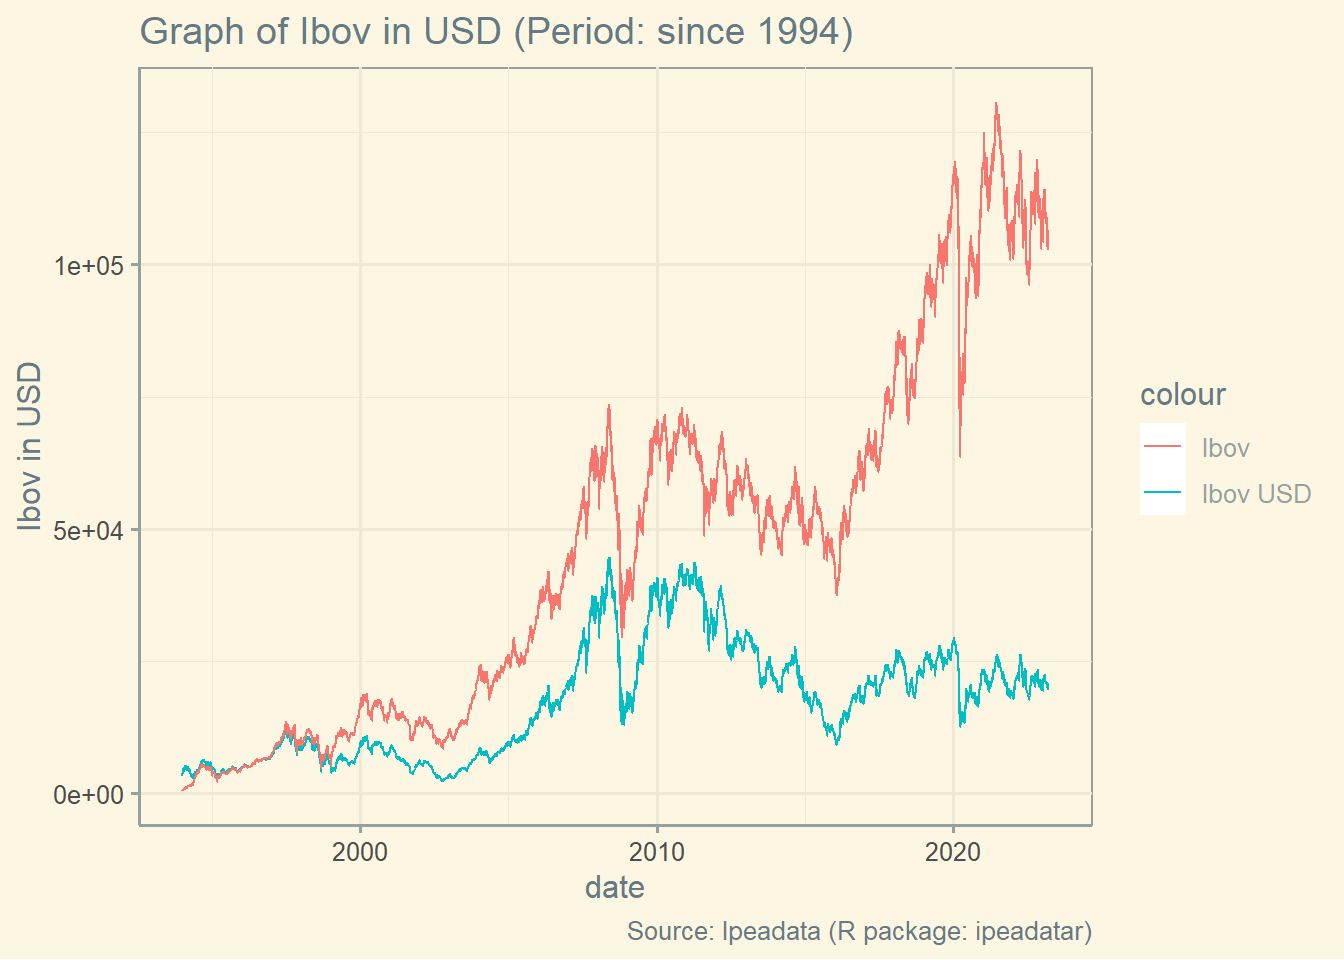
This graph is simply a reminder of the value in dollar of our Stock market index. It shows that, at the moment, Ibov in USD is not as high as one may think.
Below is a graph adding Ibov in Euro.
euro <- ipeadata(code = "GM366_EUROC366")
euro <-subset(euro, select=-c(tcode,uname))
data2 <- merge(ibov,euro, by = "date")
data2$ibov_euro <- (data2$value.x/data2$value.y)
ggplot(data) +   geom_line(aes(x = date, y=ibov_dolar, colour="Ibov USD") ) +   geom_line(aes(x = date, y=value.x, colour="Ibov") ) + geom_line(data= data2 , aes(x = date, y=ibov_euro, colour="Ibov Euro") ) +
  labs(y='Ibov in USD & Euro',
       title = "Graph of Ibov in USD & Euro (Period: since 1994)",
       caption = "Source: Ipeadata (R package: ipeadatar)") + theme_solarized()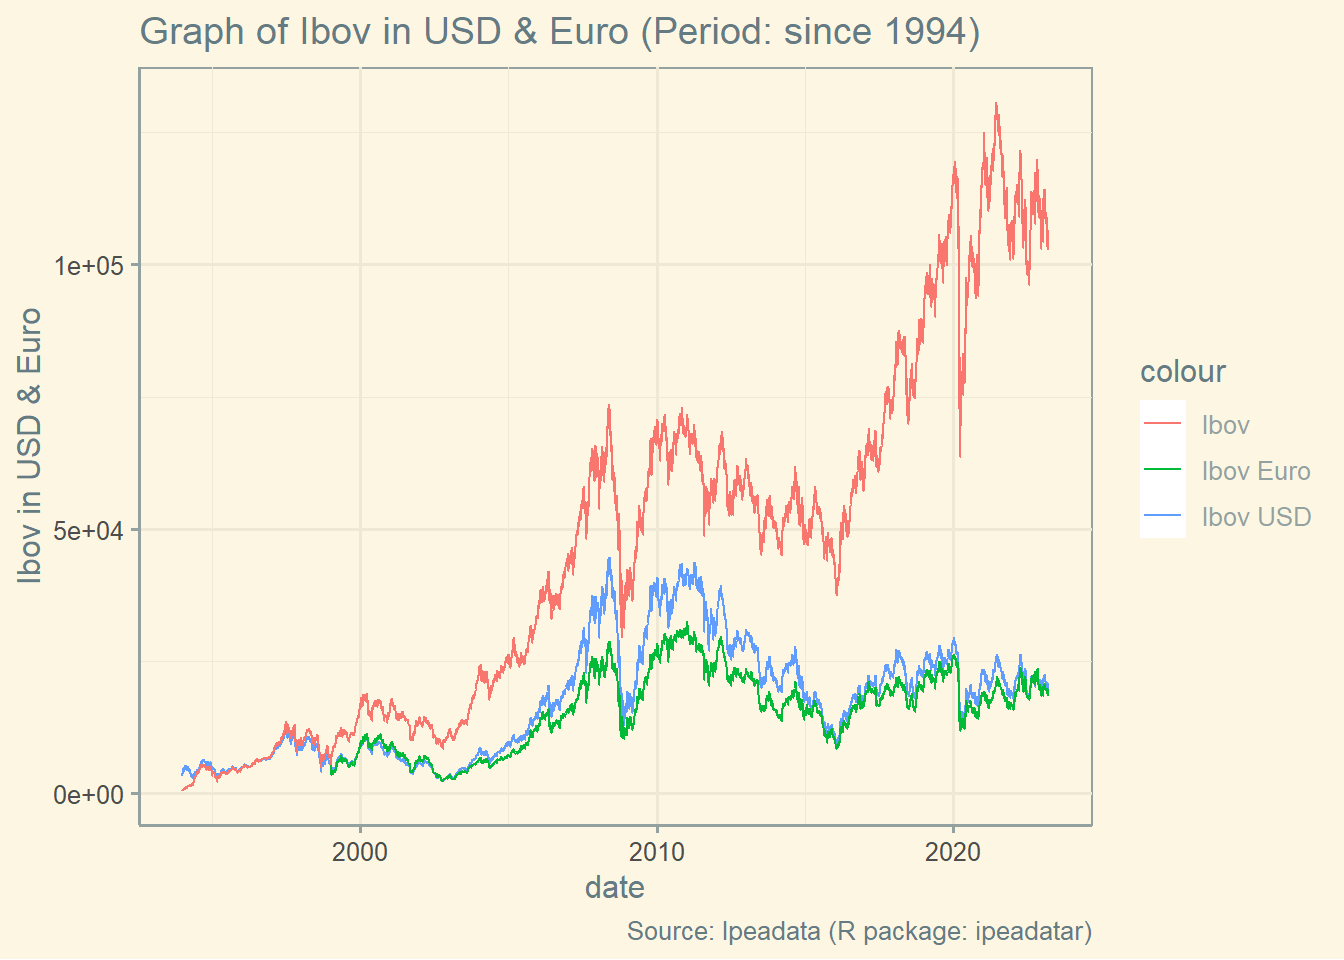
Thanks for passing by!