Brazil Economic Policy Uncertainty

Open Data
Open Code
Brazil
EPU

Graphing EPU

Author

Henrique C. Martins

Published

August 12, 2022

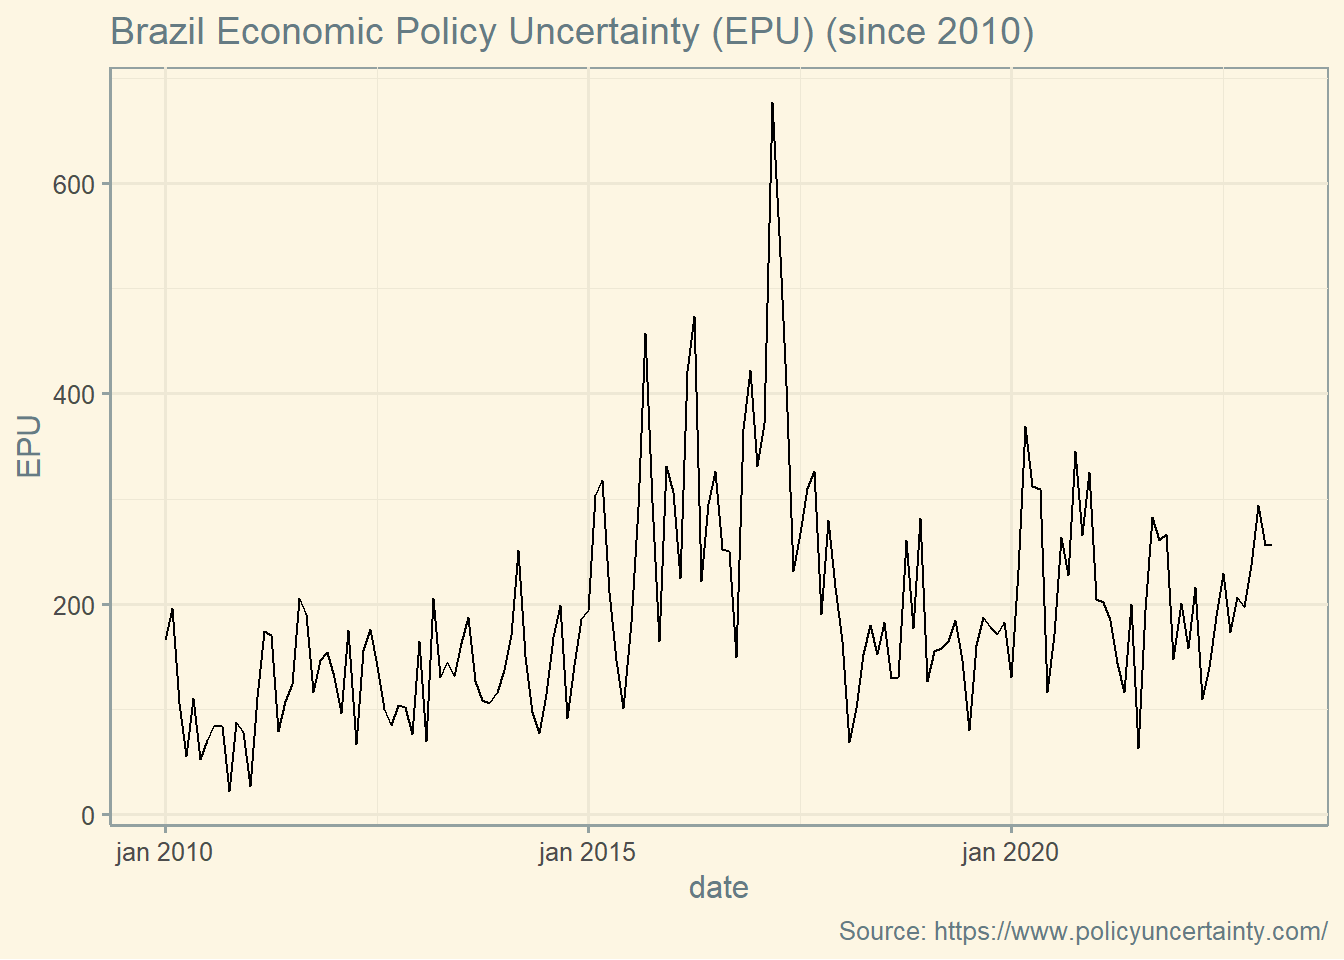
In this post, I will show how to create a graph about the Brazilian Economic Policy Uncertainty index. For more information about this index, click here. Shortly, it is an index that calculates economic policy uncertainty by searching for specific words in Brazilian newspapers.

Let’s download the data and create a graph to see what happens.

library(readxl)
library(httr)
library(zoo)
url1<-'https://www.policyuncertainty.com/media/Brazil_Policy_Uncertainty_Data.xlsx'
GET(url1, write_disk(tf <- tempfile(fileext = ".xlsx")))
Response [https://www.policyuncertainty.com/media/Brazil_Policy_Uncertainty_Data.xlsx]
  Date: 2023-03-16 20:58
  Status: 200
  Content-Type: application/vnd.openxmlformats-officedocument.spreadsheetml.sheet
  Size: 11.9 kB
<ON DISK>  C:\Users\hcmrt\AppData\Local\Temp\RtmpuWiLrJ\file24dc1dc71136.xlsx
data <- read_excel(tf)
colnames(data) <- c("Year", "Month", "EPU")
data<- data[1:nrow(data)-1,]
data$date <- as.yearmon(paste(data$Year, data$Month), "%Y %m")

data <-subset(data, Year >= 2010)

Finally, let’s create a graph:

library(ggplot2)
library(ggthemes)
ggplot(data= data, aes(x=date, y =EPU ) ) + geom_line() + theme_solarized() +
  labs(title = "Brazil Economic Policy Uncertainty (EPU) (since 2010)",
       caption = "Source: https://www.policyuncertainty.com/") 

Well, it seems that we do not have too much uncertainty at the moment. At least not the type of uncertainty that this index measures. Still, this is a nice index to learn more about.

Thanks for stopping by!